| The Histogram Panel |

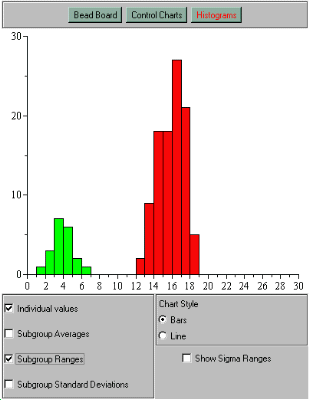
This is the simplest of the components. It is provided for you to be able to see the way the data collected from the board are distributed.
Although the bead board itself shows the distribution of the individual values, it has two limitations. Firstly, the collectors can only display a certain number of beads. When the total number of beads is large, there is a good chance that several of the collectors will actually contain more beads than they can display, thus distorting the picture of the distibution provided by the board.
Secondly, the board will only provide information about the distribution of the individual values. The histogram panel was included because it also allows comparisons to be made between the distributions for the three most significant statistics: the subgroup averages; the subgroup ranges; and the subgroup standard deviations. For example, you can see how the subgroup averages form a narrower distribution than the individual values, thus emphasising the differanece between control limits and natural process limits.
Because of the way that the histograms had to be implemented, it is impossible to ensure that any particular set of bars will be drawn on top of another set. The order in which the bars are drawn is very much dependent upon the patform you are using, and the type of browser. As a result, there is a fair chance that the set of bars for the individual values will hide the much smaller bars for the subgroup averages. To compensate for this, there is an option to view the data in the form of linegraphs, rather than bars. In this form, it is possible to make direct comparisons between the different distributions, without having to worry about one set of data obscuring another.
The controls for this panel are quite straightforward. On the left hand side there are four checkboxes which allow you to select which data to view. You may select any or all of the four available options:
Chart Style
Use these checkboxes to switch between bar chart or linegraph display.
| UP: The Bead Board Applet | BACK: The Control Chart Panel |