|

There are many models for making improvements, all of which try to provide a
set of actions or steps that can be learned and followed.
The Plan - Do - Check - Act ( P - D - C - A ) cycle has been in use for many years,
it provides an easily learned format and straight forward guidance on use of quality
tools.
|
|
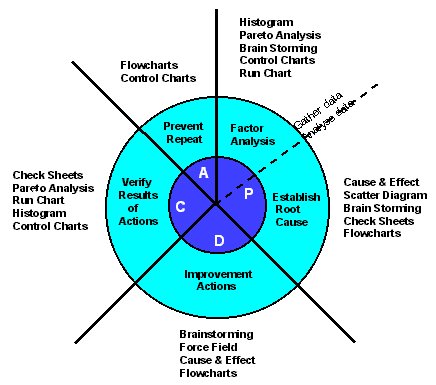
Overview
Plan
- Gather all of the data and information appertaining to the concern or problem.
- Establish all of the possible causes of the problem and agree on (define) the
root cause. Trials to prove the root cause may be necessary.
- Develop a solution and action plan.
Do
- Implement the solution or corrective action.
Check
- Monitor and confirm the results of the action.
Act
- Act on learning to prevent recurrence of the problem. Standardise on best
practice where possible.
Methodology
Plan
- Gather the data
- Obtain facts, ideally as measured or counted data.
- Process and product measurements are the best source of facts.
- Never rely upon guesswork or opinions.
- Establish possible causes
- Brainstorming is very important.
- Flowcharts are used to focus on process factors.
- Cause and Effect diagrams can illustrate possibilities.
- All possible causes should be examined.
- When final identification amounts to guesswork, trials should be carried out.
- Check Sheets and Scatter Diagrams are useful for trials.
- Trials should give measurements or counts for objective decision making.
Do
- Implement solution
- Use experience and common-sense to identify corrective action.
- Brainstorming, Cause and Effect Diagrams and Force Field Analysis can all
be used to identify the most promising solution.
Check
- Monitor and verify results of action
- Check Sheets, Pareto Analysis, Run Charts, Histograms can all be used to
measure change, as can the more informative Control Chart.
Act
- Prevent recurrence
- Change process.
- Ensure all documentation is up to date.
- Ensure changes are visible. Flowcharts and Control Charts are useful.
- Review if solution can be applied to other products / processes.
- Ensure changes are followed up by work team training.
| Tool Type |
Identify Problem |
Establish Root Cause |
Problem Solution |
Verify Actions |
Section |
| Brainstorming | # | # | # | | 2.2 |
| Flowchart | | # | # | | 2.3 |
| Scatter Diagram | | # | | | 2.4 |
| Pareto Analysis | # | | | # | 2.5 |
| Histogram | # | | | # | 2.6 |
| Run Chart | # | | | # | 2.7 |
| Force Field Analysis | | | # | |
2.8 |
| Check-sheet | | # | | # | 2.9 |
| Cause & Effect Diagram | | # | # | | 2.10 |
| Control Charts | # | | | | 2.11 |
|