
Purpose
A pareto chart is used to identify which problem areas would have the greatest
impact on overall improvement. The chart is a series of bars whose heights show
the frequency or size of problems. The bars are arranged in descending order of
height from left to right, with the taller bars representing the larger problems.
The chart is based on the Pareto principle: 80% of the trouble comes from 20% of
the problems.
How does it work ?
- Focuses on the problems or causes which would give the greatest benefit if solved.
- Helps prevent the problem moving when a solution removes a cause but makes
others worse.
- Progress is displayed in a visual format, which provides incentive to strive for further improvement.
Causes of Heat Loss in the Workshop
 |
Problem Type
- Draughty Windows
- Roof
- Doors
- Walls
- Other
|
Method
1) Define the causes or problems to be monitored.
( This can be achieved by either brainstorming, eg. what are typical causes of
reject parts?, or existing data, eg. how many of these parts were rejected? )
2) Choose the most relevant unit of measurement such as percentage or cost.
3) Identify the period of time to be covered by the study.
( Choose a time period that is long enough to represent the situation, allowing
for holidays etc.)
4) Collect the required data on each of the problem categories.
5) Draw the pareto chart.
Example:
Scrap Components by Factory Area
| Area | Scrap Qty. | %age |
| Flanges | 100 | 14 |
| Bars | 175 | 25 |
| Discs | 52 | 8 |
| Drums | 220 | 32 |
| Yokes | 48 | 6 |
| Bells | 98 | 14 |
| Total | 693 | |
The team monitoring this problem
decided that they would only chart
the top five causes.
Scrap Percentage by Factory Area
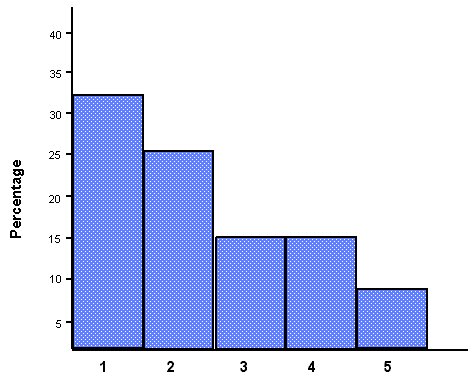 |
Area;
- Drums
- Bars
- Flanges
- Bells
- Discs
|
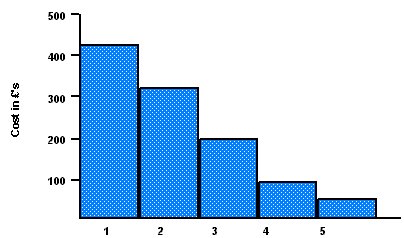
6) Interpret the Results
Generally the tallest bars indicate the major contributors to the overall problem.
Dealing with these categories first is the logical approach. However, using the
example of the scrap components, the cost of one of the lesser contributors
may be greater than that of the largest. It is important to ask: What has the
most impact on the goals of the business and customers ?
Points
- Most problems require more than one pareto diagram, each exploring a different
question.
- Decide what pareto diagrams you want before data collection begins.
- Find the appropriate categories by asking the questions: what, where, when, who,
why and how.
|