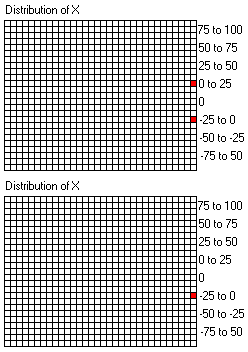
Once again, you need to transfer this information to the chart. First of all, fill in the recording boxes for the second column.
| Module | A6 | A5 | ||||||
|---|---|---|---|---|---|---|---|---|
| Date Completed | 20/8 | 21/8 | ||||||
| Actual | 33.0 | 37.5 | ||||||
| Estimated | 37.5 | 30.0 | ||||||
| X | -4.5 | 7.5 | ||||||
| mR |
You should also enter this information on the distribution of X graph:

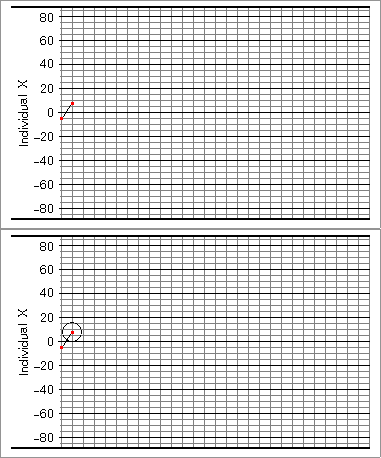
Then you need to plot the the second point on the X graph, and join the two points with a straight line.
