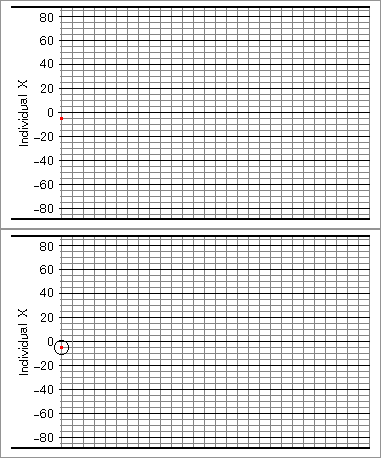
You should now enter this data in the first set of recording boxes on the chart that you have printed. Note that the mR box in this first column is left blank because we cannot calculate a moving range with only a single value.
| Module | A6 | |||||||
|---|---|---|---|---|---|---|---|---|
| Date Completed | 20/8 | |||||||
| Actual | 33.0 | |||||||
| Estimated | 37.5 | |||||||
| X | -4.5 | |||||||
| mR |
You can now plot the first X value at the appropriate point on the first line of the X graph.

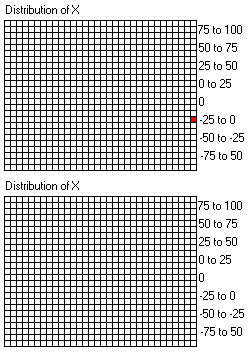
Because we have only calculated one X value so far, we cannot calculate a moving range yet. Therefore there's nothing to do on the moving range graph. However, you do need to add a mark to the distribution of X graph against the appropriate class.
