The next step is to find the range of the items in the sample. This is found by subtracting the weight of the lightest item from that of the heaviest:
Range = 178 - 175 = 3
You should then add this value to the last box in the first column as shown below.
| Date | 01/04 | ||||||
|---|---|---|---|---|---|---|---|
| Time | 01:00 | ||||||
| 1 | 177 | ||||||
| 2 | 176 | ||||||
| 3 | 178 | ||||||
| 4 | 177 | ||||||
| 5 | 175 | ||||||
| Sum | 883 | ||||||
| Mean | 177 | ||||||
| Range | 3 |
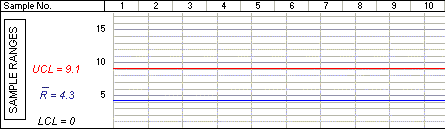
You then add this value to your chart. This range value of 3 is then plotted on the R graph at the point where the first vertical line meets the horizontal line representing the value of 3. Do this now on the graph below, by clicking the correct point.