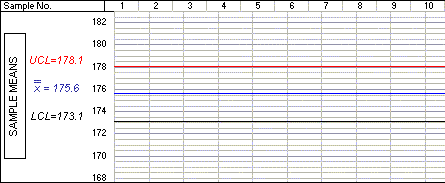
Having calculated and recorded the mean of the sample, you must now plot this value on the graph. You do this by placing a point where the first vertical line meets the horizontal line representing the value 177.
Click on the graph below to indicate the correct position of the point.
