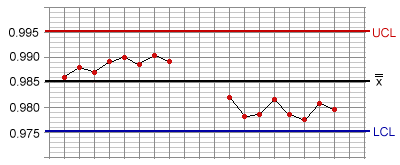
| Key: |
| UCL = Upper Control Limit |
| LCL = Lower Control Limit |
A run of 8 or more consecutively plotted points occurring on one side of the mean is a sign that a shift or trend in the process has begun.

| Key: |
| UCL = Upper Control Limit |
| LCL = Lower Control Limit |
Note: A plot on the process mean is included in the run.
Runs can indicate a step change in the process, resulting from, for example:
A run below the mean indicates an improvement on Range, Standard Deviation, and Attribute charts.