| Key: |
| UCL = Upper Control Limit |
| LCL = Lower Control Limit |
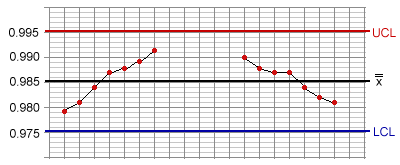
A trend of 7 or more consecutively plotted points in either an upward or downward direction indicates the potential presence of a special cause in the process.

| Key: |
| UCL = Upper Control Limit |
| LCL = Lower Control Limit |
Note: 2 consecutive plots of the same value are considered part of the same trend.
Trends can indicate process change resulting from many things, for example:
A downward trend indicates an improvement on Range, Standard Deviation, and Attribute charts.