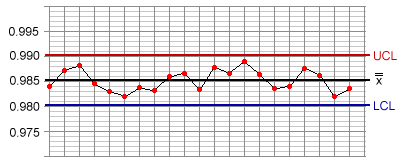
| Key: |
| UCL = Upper Control Limit |
| LCL = Lower Control Limit |
Control charts are often used with the principle objective of highlighting special causes. This is most easily done when the picture of the process in its controlled state (i.e. with no special causes present) is known.
This is often difficult to achieve in real life and the practical solution is to recognise those special causes present when preparing the chart and to work to the approximate in-control state.

| Key: |
| UCL = Upper Control Limit |
| LCL = Lower Control Limit |
The chart above illustrates a process that appears to be in control and where no immediate action is required.
Chart interpretation amounts to recognising patterns, particularly unusual ones.
The person plotting the chart acts as the first link in the chain of process control. At all times, the chart plotter should act within the framework of local operating instructions.
A special cause can be signalled on the chart by: