| Key: | |
| USL = Upper Specification Limit | UCL = Upper Control Limit |
| LSL = Lower Specification Limit | LCL = Lower Control Limit |
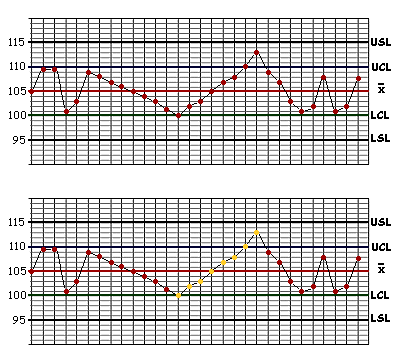
If you look at the Control Chart below, however, you can see that there is a run where each beam produced is slightly longer than its predecessor.

| Key: | |
| USL = Upper Specification Limit | UCL = Upper Control Limit |
| LSL = Lower Specification Limit | LCL = Lower Control Limit |
Indeed, one beam produced was 112cm in length and the plot for this beam lies above the graph's Upper Control Limit. This is a very clear indication that something is going wrong with the process. Even though this beam would still meet the customer's specification, the process is no longer stable and predictable, which means we can no longer expect future outputs to fall within the existing control limits.
Note: It is not good practice to include specification limits on a control chart. It is often confusing, and can frequently be misleading (as in the case of Mean and Range Charts, where one is dealing with averages rather than individual values). The two sets of limits have been shown together here for example purposes only.
Specification limits are often referred to as the Voice of the Customer, while control limits are termed the Voice of the Process. There should be a clear separation between the two. While customer requirements are important in terms of quality, control charts speak only with the voice of the process.
Fill in the missing word in the sentence above, then click the button to check your answer.