| Key: |
| UCL = Upper Control Limit |
| LCL = Lower Control Limit |

| Key: |
| UCL = Upper Control Limit |
| LCL = Lower Control Limit |
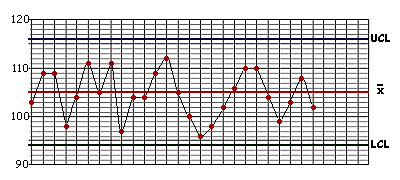
On this graph, we have the same information as shown
on the run chart, but instead of showing the specification limits,
we have drawn on the process's Control
Limits (marked UCL for Upper Control Limit and LCL for Lower
Control Limit. The third line, labelled ![]() represents the
process's mean (i.e. the average length
of the steel beams).
represents the
process's mean (i.e. the average length
of the steel beams).
The Control Limits represent the natural limits of the process, i.e. what it will produce when it is working normally.
Choose an option and then click the button to check your answer.