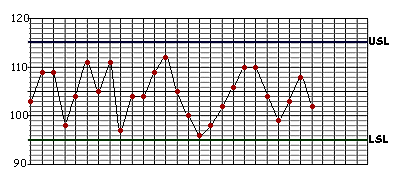
| Key: |
| USL = Upper Specification Limit |
| LSL = Lower Specification Limit |
Monitoring the process lies at the heart of SPC. This entails plotting data on the process' outputs against criteria established beforehand. The purpose of such monitoring is to record information on the process, including its inputs and inherent performance, in addition to its outputs.
Let's see how it works.

| Key: |
| USL = Upper Specification Limit |
| LSL = Lower Specification Limit |
This run chart shows the length of steel beams as they come off a press. The customer's order specified that these beams should be 105cm ± 10cm (i.e. no shorter than 95cm or longer than 115cm). Each point on the chart represents the length of a single beam, and the two horizontal lines show the upper and lower specification limits established by the customer. (If you want to check that you're reading the chart correctly, move your mouse pointer over any of the red dots, and the value for that point should be displayed.)
So, what does this chart tell us about the beams? In fact, all it actually tells us is that:
And, in far too many cases, this is as far as people go in monitoring the performance of the process. As we shall see, however, this is only the first step.