- The history of the measure.
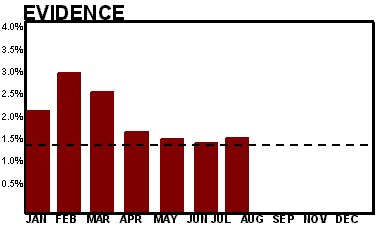
- This graph shows the scrap volume as a percentage of total parts produced.
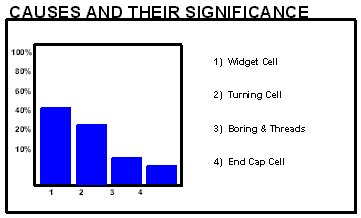
- Pareto identifying the area and the amount of scrap produced as a percentage of total scrap.
- The area should run a 2nd level KPI to identify which process' are the major contributors.
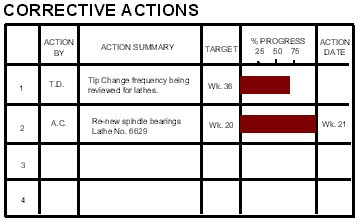
- This summarises the corrective/improvement activities taking place.
- The number in the fault column, ie. 1, refers to the area which is identified as the major contribuributor to scrap produced,No. 1 on the pareto.
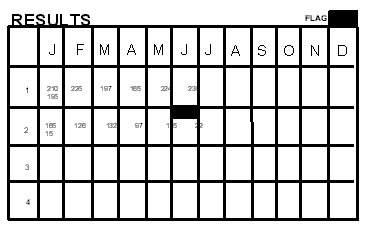
- Each months entry will show the data from the area/concern. When an action is completd,a flag is inserted into the months block. If the action is successful, the results reflect this and, in time, the pareto analysis will not identify it as an action item.