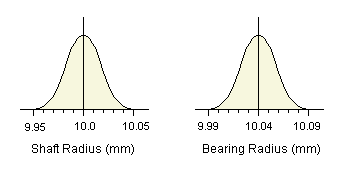
If the overall variation in the shaft and bearing processes were reduced by 50%, the standard deviation for each of the two processes would be 0.015. If we centre the shaft process at an average of 10.0mm and the bearing average at 10.04, then the shafts would vary in the range 10.0mm ±0.045mm, and the bearings in the range 10.04mm ±0.045mm. 
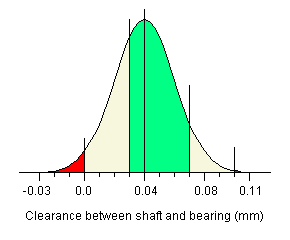
What effect would this have on the distribution for the clearances for a set of random assemblies? Using the same formula as before: we can calculate the standard deviation for this distribution to be 0.21. The average gap would be 0.04mm (10.04 - 10.00). The distribution curve is shown below.  The differences with this approach should be quite plain. The red area below 0.0 which shows the proportion of assemblies that will not fit together is considerably smaller than anything we have seen so far. Furthermore, the proportion of assemblies which will have an unacceptably large gap is practically non-existent. In fact the percentages are as follows:
Using these percentages, we can construct a table to show what will happen at each level of assembly and reassembly.
In total, we will have had to go through the process of assembling a shaft and bearing 1031 times to get our 1000 final assemblies, of which 998 will be acceptable, and about 618 will be ideal. |