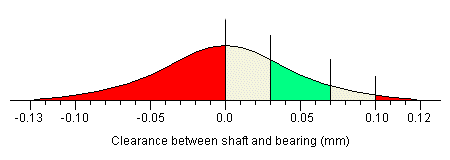
Attempt 6Finally, if we shift the average bearing radius down to 10.0mm, we will get the following distribution. 
As you can see, the proportion of assemblies which will be too loose is very small, while the probability of finding that a randomly selected shaft will not fit a randomly selected bearing is much greater. Also, the proportion of assemblies that will fall into the 'ideal' range has been dropping ever since the average gap fell below 0.04mm, and it is now at its lowest level. The actual figures are as follows:
Using these percentages, we can construct a table to show what will happen at each level of assembly and reassembly.
This means that of our 1000 assemblies, about 980 will be acceptable, and about 381 will be ideal. The number of assemblies which are too loose (20), is clearly a great improvement on the 136 we got at the first attempt. However, the overall quality is clearly not as high, since the number of ideal units has dropped from a high of 434 to only 381. Also, what about the labour involved in getting these 980 working units? In order to produce our 1000 final assemblies, we will actually have to go through the process of assembling a shaft and bearing 2001 times. Surely there must be a better way... |