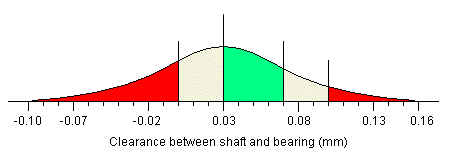
Attempt 3When we reduced the average clearance between the shaft and the bearing, the proportion of assemblies which were too loose went down, and the proportion that were ideal went up, so maybe we are on the right track. Let's try resetting the average bearing radius down by a further 0.01mm. This will narrow the average gap to 0.03mm 
The probabilities for getting random assemblies where the gap is in one of the marked ranges on the distribution are now as follows:
This means that about 240 of our initial assemblies will not fit together, about 50 will be too loose, and about 330 will be ideal. Once again, the table below shows what will happen at each level of assembly and reassembly.
At this attempt, we have gone through the assembly process 1316 times to get 1000 final assemblies, of which 934 are suitable and 434 are ideal. |