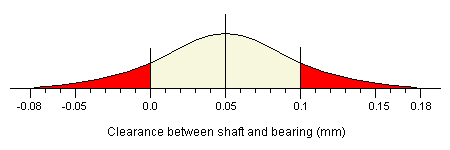
Having established that both processes are capable of meeting the specifications, we now turn to the operation of assembly. Statistical theory tells us that the distribution of the gaps between randomly selected shafts and bearings will have the following characteristics:
Since we know that the standard deviation for each process is 0.03, we know that the variance for each process will be 0.03 squared, which is 0.0009. We can insert this figure into the formula given above to find: 
The average gap will be 10.05mm - 10.00mm, which equals 0.05mm (which is of course the target value). Once again, we can expect to find almost all the values within 3 standard deviations of the mean. Using the values we have just calculated, this means that the gap will vary in the range 0.05mm ±0.13.  As you can see, for any random assembly of a shaft and bearing, there is a chance that the difference between the two parts will be less than zero, and so they will not fit together. Similarly, there is a chance that the gap will be greater than 0.10mm, resulting in a final assembly that will be too loose. By calculating the areas under the curve which are below 0.0mm and above 0.10mm, we can work out the mathematical probabilities for these two occurrences. This calculation tells us that there is about a 12% chance that the components will not fit together, and there is also a 12% chance that the final assembly will be too loose. |