The Empirical RuleThe general robustness of control charts is due in no small part to the statistical rule of thumb known as the Empirical Rule. This states that for data which are normally distributed, one can expect to find the following:
Normally distributed means that the pattern formed by the data, when plotted on a histogram, is roughly bell shaped. The following chart is a histogram of results obtained from an experiment with the bead board, and a theoretical normal distribution curve has been superimposed. 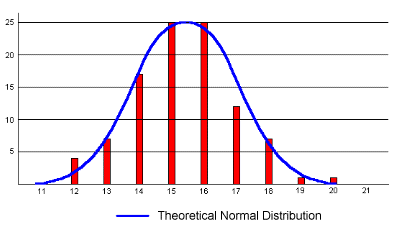
|