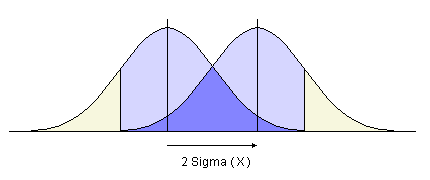
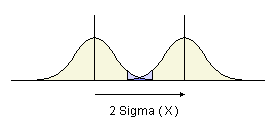
The delay in detecting a change in the process average is shown even more clearly in the case of a shift of 2 sigma units.  There is a greater chance than before that a value will fall beyond the upper limit for the old process average, and therefore appear as an out of control point. However, the probability of a value lying within the old limits is still much larger, and thus a chart for individual values would be unlikely to detect even so large a shift as two sigma units at an early stage. The amount of overlap between the subgroup distributions, on the other hand, is negligible under these circumstances.  A chart which monitors the subgroup averages will show almost all of the values centred around the new average as out of control. Such a chart will therefore provide a much earlier warning of a change in the process average than an individuals chart. |