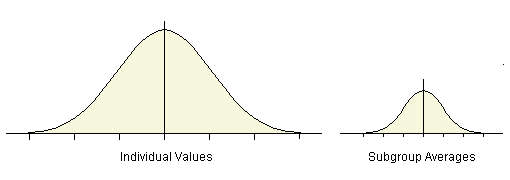
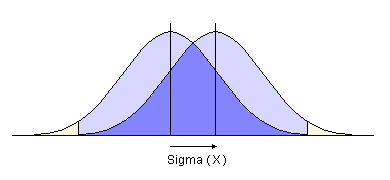
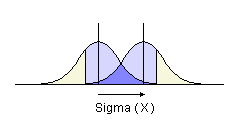
If we look at some hypothetical distribution curves for individual and subgroup data, we can see the effect that a shift in the process mean will have. The relationship between the curves in the following diagrams is based on subgroups of size 5.  The range of the individual values is 3 sigma units above and below the average. What will happen if the process average shifts from its current position by 1 sigma unit?  The distribution of individual values around the new process average covers much the same range as that at the old average. Any value of X which falls within an area shaded blue could come from either distribution. It is only when a value falls in one of the small, pale coloured areas at either extreme that we can be sure that it comes from either the first or second distribution. If we contrast this with a similar shift in the process average for the subgroup averages, we can see that there is a far greater chance that the change will be detected.  While there is still considerable overlap between the distributions at the old and new positions, the range of values which could only come from one or other position is much greater. |