The Use of Subgrouped DataIn order to characterise the ongoing nature of a process, control charts generally use samples (or subgroups) taken periodically from the product stream. Subgroups are used for several reasons:
The first two of these reasons are fairly self-evident, but what do we mean by the third? The distribution of the subgroup averages will necessarily be narrower than that of the individual values. This is because the process of calculating the average reduces the impact of the values at either extreme. As an example of this, consider the experiment with the bead board which we mentioned earlier. (You will have a chance to carry out this experiment yourself later on). The data were gathered by running 20 subgroups of 5 beads, recording the individual values, and then calculating the subgroup averages and ranges. Click here to see the data in table form. The individual values, when plotted on a histogram look like this. 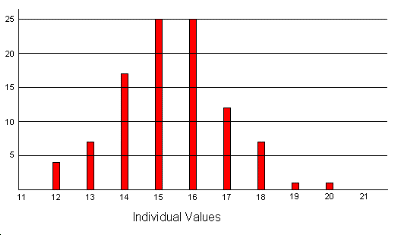
If we compare this with the histogram for the subgroup averages, we can see how much narrower the second distribution is. 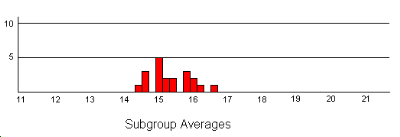
|