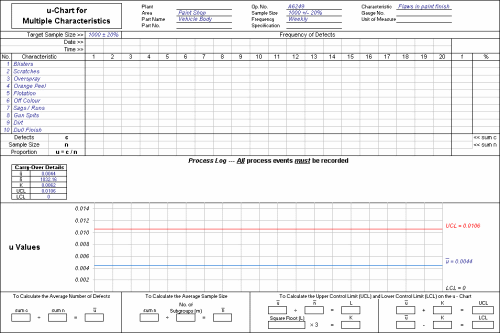
The u-Chart shown below is a scaled copy of the chart you have just printed out:

This chart has been prepared to record the number of flaws found in the paint finish on cars. Each car is inspected and a note made of any defect found. The data is collated once a week onto the prepared u-Chart.
As you can see, the chart headings have been completed and the list of defect characteristics has been written into the data collection area. A vertical scale has also been added to the graph, and the lines representing the mean and upper and lower control limits have been drawn. This chart is ready to use.
What type of data does this u-Chart record?