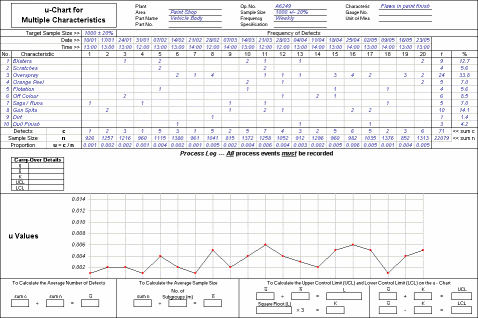
In the previous section, How to Plot a u-Chart, we looked at the way you record data and plot the points on a u-chart. In this section we will be looking at the way you calculate and add control limits to the graph.
We will be using data from the same car spraying process as in the previous exercise. You may recall that, of the ten defect characteristics being monitored, there were two that occurred very much more frequently than the others. These were orange peel and sags/runs. To try and reduce the occurence of these defects a new type of tip is being used on the spray guns. Because of this change in the process it is appropriate to recalculate the control limits.
The image below shows a chart that has data from 20 samples recorded on it. In this exercise, we will be using these values to calculate new control limits for the process. You will need to print out a copy of the chart to work on during the exercise.
