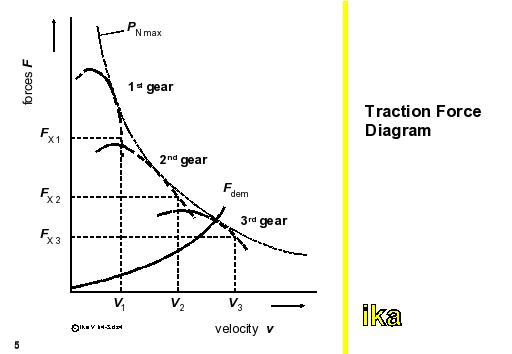
From the speed-velocity-diagram already indicated in the previous chapter, the velocity dependent traction force available at full engine load for different transmission levels can be determined.
When the road resistances are included, e.g. at constant velocity in the plane, a so-called traction force diagram (as in the figure) which compares the demand and supply, can be drawn up. Possible vehicle operating points are indicated by the intersection of the road resistance and traction force curves. In addition, the curve of maximum power (power hyperbola) is also included as a function of driving speed.
After having multiplied the respective traction force supply and demand with the particular driving speed, the hub power PH available at the wheels and the demand power Pdem necessary for driving at a constant velocity in the plane can be compared: