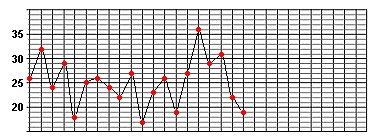
Let's suppose instead that Mr. Smith had decided to produce a set of run charts, one for each month.

The chart above is for the month of May. As you can see, it is already easier to pick out the peaks and troughs of Mr. Smith's daily journeys.
It is the immediate visual impact of such graphs that makes them so useful.