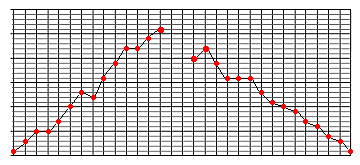
If, however, you were told that the chart on the right showed the sales for the month while that on the left showed the cost of each sale per member of staff, your reaction would be different!

So, the data can look the same; it's the context in which it is presented that is important.