Your completed table should look like this:
| Defect | Count | % | Cum. | Cum. % |
|---|---|---|---|---|
| Sags / Runs | 35 | 42 | 35 | 42 |
| Orange Peel | 30 | 36 | 65 | 78 |
| Blisters | 4 | 5 | 69 | 83 |
| Scratches | 3 | 4 | 72 | 87 |
| Overspray | 3 | 4 | 75 | 90 |
| Flotation | 3 | 4 | 78 | 94 |
| Gun Spits | 2 | 2 | 80 | 96 |
| Off Colour | 1 | 1 | 81 | 98 |
| Dirt | 1 | 1 | 82 | 99 |
| Dull Finish | 1 | 1 | 83 | 100 |
| Totals: | 83 | 100 | ||
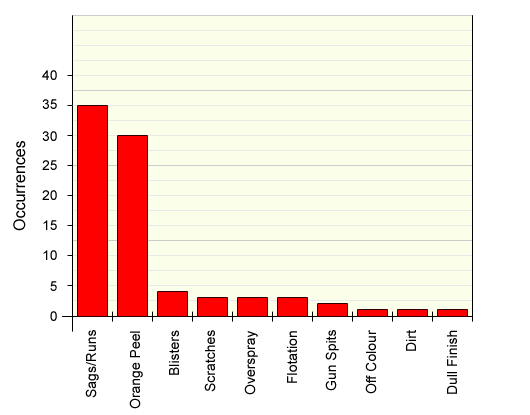
We're now ready to draw the pareto chart. The first stage is to draw a bar chart with the defects ranked in descending order. You can print out a blank chart to work on, or draw the chart yourself from scratch.
Your completed bar graph should look like this:
