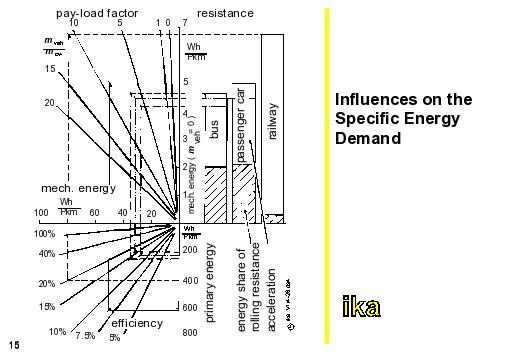
The indicated reduction possibilities can be estimated from a comparison diagram of specific energy demand. In this case the applied energy demand is to be referred to a specific target application. The figure shows the results of a parameter study conducted for types of local public transportation involving busses, passenger cars, and trains. The number of transported passengers along with the distance covered are considered as application targets here.
For the passenger car, the ECE-cycle was assumed here as the representative driving course. For buses and trains, respective cycles which maintained the statistical averages for acceleration, driving velocity and the distance between stations were chosen. The speeds achieved in all cycles are so small that the air resistance can be neglected (WL<0.1·Wdem).
In quadrant 'A', both dominant portion of energy from the wheel as well as acceleration resistance are indicated, initially considering a mass-less vehicle, meaning the proportion of energy only required for the transportation of "pay-load". Under normal conditions, in today's vehicles this net mechanical energy demand amounts to 5 Wh/Pkm.
In the quadrant 'B' this energy demand is multiplied with the ratio total mass/pay-load. In a passenger car, this results in an average mechanical energy demand of approx. 50 Wh/Pkm on the driven wheels.
The energy that finally has to be employed as primary energy is determined in quadrant 'C'. An efficiency ηges is defined here which refers to the ratio of energy required for driving through a cycle to the supplied primary energy. By improving the pay-load factor and the total efficiency, the specific energy demand can be significantly reduced.