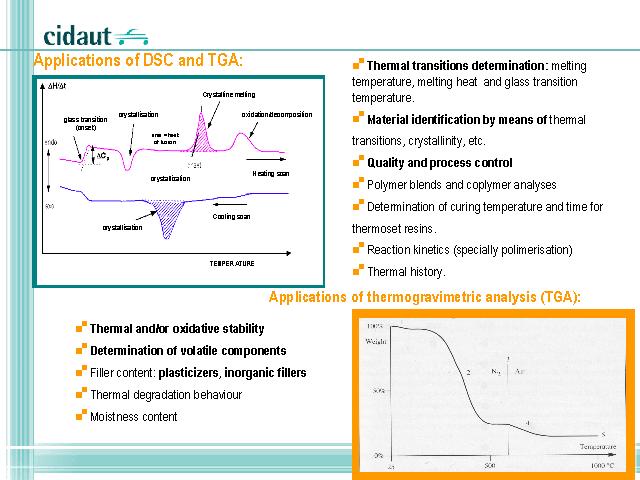
At the right a typical DSC thermogram of a polymer is shown, where most of the transitions associated with a polymeric material are present. The upper curve of the thermogram is a heating scan, and the blue curve is a cooling scan.
The thermal history of the material is represented in the heating scan. First, glass transition temperature is observed, followed by a crystallization process (when the sample have not been previously crystallized). Then melting and finally degradation transitions are observed. It is important to note that heating scan provides: fusion enthalpy, melting temperature (peak temperature for the corresponding endotherm) and crystallinity degree. On the other hand, cooling scan indicates the material fraction that has crystallized according to previews melting and the crystallization temperature.
At the left side a typical TGA thermogram of a polymer material is shown. The first change observed (1) is related to emission of volatile materials from the sample. The change observed on the slope of the curve (2) is associated to the polymer decomposition. The point number 3 is concerned with a atmosphere change in the experiment. At point 4 a carbonization process takes place (carbon fibres, carbon black) and finally, point 5 is related to residues (glass fibres, ashes).