|
Control Charts - Methods (2)
|
5) Control charts for Attributes
Where requirements are subjective, and direct measurement is not possible,
such as absenteeism,they can be monitored with
an attribute chart. The data type used is "go" or "no - go" against an
acceptance standard.
- The charts for attributes described in these guidelines are :
- p charts - deal with defectives, which are units that fail because of defects.
- c and u charts - deal with the defects themselves, or the reasons why the
units fail.
- Attribute charts are similar in appearance, but each has its own formulae
for the calculation of mean and control lines.
5.1) Sample selection
- The size of sample is governed by one major guideline, the sample must be
large enough to allow the defect to appear in the majority of samples taken.
- Successive sample sizes do not need to be constant, but there will be less
calculation involved if they are.
- c charts deal with constant size samples.
- p and u charts deal with variable sized samples.
- Samples should be taken at random intervals, to reflect all likely special
cause occurrences, but, if at all possible,the units which make up a single sample should have been
produced consecutively.
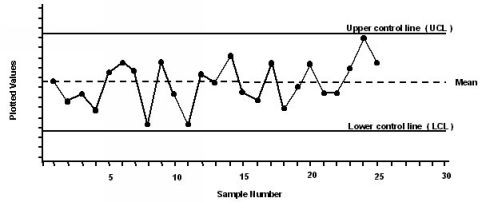
Figure 6
An attribute control chart
5.2) Chart types
p Chart for Proportion of Defectives
- The p chart is used when :
- there is a variation in successive sample size
- the data is expressed as the fraction, or proportion, of defectives in the sample
- Sample sizes should not vary by more than +/- 25% of the average sample size.
c Chart for Number of Defects
- The c chart is also used to illustrate independent data that is not of attributes,
such as accidents. In such cases the chart is similar to a Run Chart
- Samples can be:
- a single unit, such as an assembly.
- a constant sized group of units, such as an audit batch.
- a measured production output such as an area of material.
u Chart for Proportion of Defects
- The u chart is similar to the c chart. The differences are that :
- the sample size can vary.
- the plotted data is the average number of defects per unit in the sample.
- Sample sizes should not vary by more than +/- 25% of the average sample size.
Figure 7
Attribute chart statistics and formulae
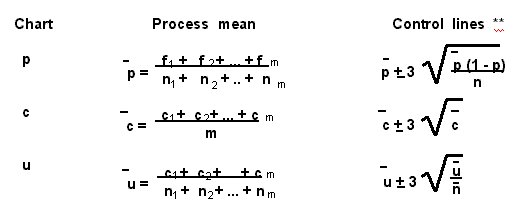
Key to symbols :
c Defects (faulty features) in sample
f Defectives (faulty units) in sample
n Sample size
m Number of samples
|
n Average sample size = (n (bar) 1 + n2 + ** + nm)/m
u Defects per sample size = c/n
p Proportion of defectives in sample = f/n
| |
** The lower control line is drawn at zero when
the calculation gives a negative number.
|
6) Chart interpretation
- A control chart is a pictorial representation of the behaviour of a process.
Charts can be used to illustrate;
- variation from targets.
- process stability.
- the effects of a process change.
- the presence of special causes of variation.
An understanding of the picture is important, as occasionally the
significance of what is being shown may not be obvious. This can result
in either unnecessary action, or, no action. Both of which are undesirable.
The key is to know some basic principles of interpreting the picture, to
enable a decision on the course of action required.
6.1) Interpreting variable charts (  & R, & R,  & R) & R)
- The range (R) chart is examined first. This provides the picture of the
process variability, or how consistently the process performs.
If this shows a state of statistical control, the process is judged as being
stable. (Ref. Figure 8)
- The mean ( ) or median ( ) chart is examined second. This gives a picture
of process setting about the mean. Examined in isolation, this picture
could be misleading. The stability of the process needs to be known.
- If the mean or median chart shows a state of statistical control, any changes
in setting are probably caused by common causes. (Ref. Figure 8)
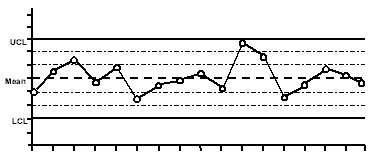
Figure 8
In control process
|
Plot proportions
|
|
Where plots should be for a
statistically in-control process.
|
|
In-control pattern
|
|
Plots showing an in-control process
|
6.2) Interpreting attribute charts ( p, c, u )
- The charts give a picture of process variability
- If their patterns indicate a state of statistical control, it means they are
stable, but not improving. (Ref. Figure 8)
- For an attribute chart, the target is zero defects and a downward trend
indicates improved process control.
6.3) Identification of out of control patterns or special causes of variation.
- The rules to be used should be determined before plotting the data.
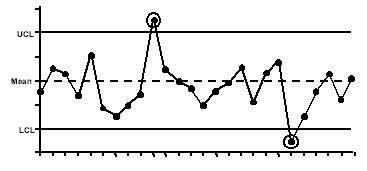 |
1) Out of the control limits
Rule: One point is outside the upper or
lower control limits.
A special cause, possibly a;
broken tool.
operator mistake.
machine failure.
|
|
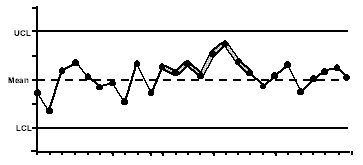
2) Run
Rule: 8 points in a row are on one side of
the centre line.
Usually a process step change caused by;
re-setting.
management intervention.
parts or method change.
|
|
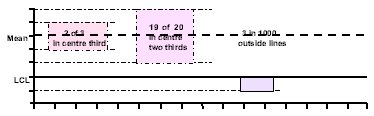
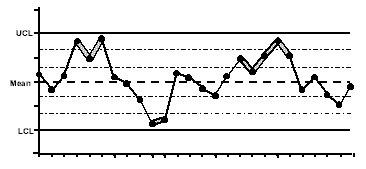
3) Approach to the control limits.
Rule: 2 out of 3 consecutive points are
in the top or bottom sixth of lines.
4 out of 5 consecutive points are
in the top or bottom third of lines.
Possibly a special cause such as;
start-up effect.
untrained operator.
|

|
4) Unnatural patterns
Rule: 16 consecutive points are alternating
up and down. Other consecutive
patterns should trigger interest.
8 times is a useful rule of thumb.
This often indicates the use of false data.
|
6.4) A strategy for using the guidelines.
- Always use rule 1
- Usually use rule 2 alongside rule 1; often it is the only way to indicate a
reduction in variation. Both these rules are simple to operate and together
they provide an appropriate method for many situations.
- Use rule 3 if you wish to increase your sensitivity to change, and the people
using the control charts are happy to deal with the slightly increased
complexity.
- Always use rule 4; you can use this rule with run charts. However, beware,
it is all too easy to see "unusual patterns". Be sure that the pattern has
repeated sufficiently, consistently and often.
- Avoid adding other rules unless the implications of doing so are understood.
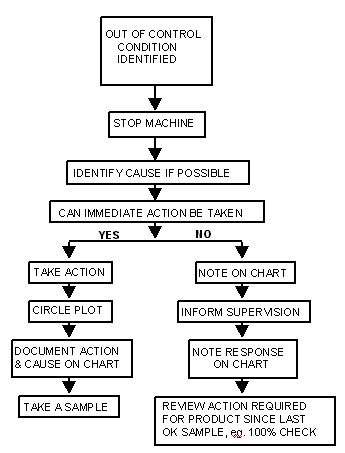
HOW TO REACT TO OUT OF
CONTROL CONDITIONS
|