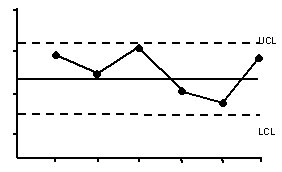
Purpose Control charts are used to monitor a process to see whether it is in statistical control. The UCL and LCL - or upper and lower control limits - indicate how much variation is typical for the process. Points that fall outside the limits, or into particular patterns, indicate the presence of a special cause of variation. How does it do it ?
|