This shows how a company used the cause and effect analysis to identify the causes of hand and wrist injuries on their production lines. By using the four categories of method, equipment, people and material, a team of operators and supervisors were able to define which causes warranted the generation of more data. 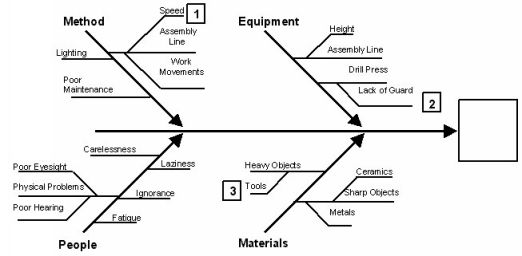 After looking at the data collected, the team decided that the speed of the assembly line was the primary cause of hand and wrist injuries. However, due to concerns about a significant decrease of output, the team decided to address another cause. They felt that the guarding on the drill presses was the next most important cause. When re-designed guards had been installed, the injury rate reduced by about 12%. The team then looked at the design of some of the tools. Improved tooling and tool handling methods resulted in another 10% reduction. Even with these reductions, the remaining causes on the fishbone are still valid, continuing to work on these will maintain the reduction in injuries. Points;
|