|
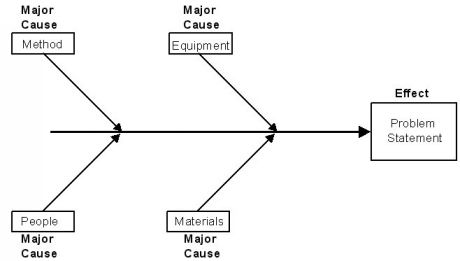
Elements of a Fishbone Diagram
|
3) Generate the causes. Brainstorming is the most commonly used method,
although check-sheets based on data previously collected can be used.
4) Place the brain-stormed ( or data based ) causes in the appropriate category.
- Some causes may seem to fit in more than one category. Ideally each
cause should be in only one category, but some of the people causes can
legitimately belong in two places. If this occurs, place them in both categories
and see how it works out.

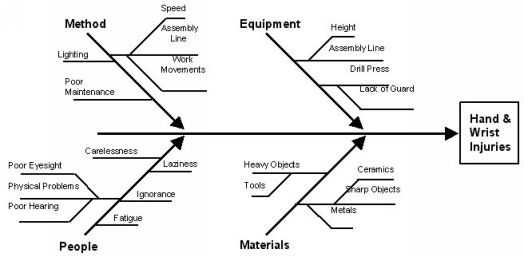
5) Ask repeatedly of the causes listed on the 'bones', either:
- " Why does this happen?" or "What could happen?"
For example, asking 'why' of the Assembly Line (Method) cause would lead
to reasons such as 'Speed' and 'Work Movements'. Enter these on the chart
as offshoots of the original cause.
- As the deeper causes appear, try for a deeper understanding of each
one - but know when to stop. A guide as to when to stop questioning is when
the manager, who may be responsible for the cause, is more than one level
of seniority above the group. Otherwise the process can become an exercise
in frustration.
- Common sense is a useful tool here.
6) Interpret or test for root cause by one or more of the following:
- Look for causes which appear repeatedly within or across major cause categories.
focusing on those which the team has control over.
- Select through either an unstructured consensus process, or one that is structured
such as multivoting.
Multivoting
Each team member rates the relative importance of causes by distributing a value
eg. 10 points, across the options. Each team member can distribute this value
among as many or few choices as desired.
| Cause | Brian | Roger | Tony | Pam | Total |
| A | 4 | 5 | 4 | 3 | 16 |
| B | 2 | 1 | 1 | 2 | 7 |
| C | 4 | 4 | 5 | 5 | 18 |
Cause C is chosen.
|