|
Cause & Effect / Fishbone Diagram
|
Purpose
Cause and effect diagrams organise ideas. They enable a problem solving team to
explore, identify and visually display all of the possible causes of a problem, or
variation, there by determining what data needs to collected to determine the
root cause.
How does it work ?
- Gives the 'big picture', displaying the collective knowledge and consensus of a
team's approach to a problem. This is beneficial in building support for the solutions
generated.
- Enables the content of a problem to be the main focus, rather than the problem's
history.
- Generates a focus on causes, not symptoms.
Method
1) Define the problem clearly.
- Make sure everyone agrees with the problem statement.
- Include as much information as possible on the 'what', 'where', 'when' and 'how much' of the
problem.)
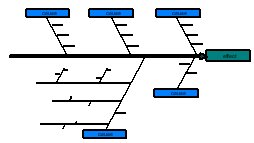
2) Construct the Fishbone Diagram.
- Place the problem statement in a box on the right-hand side of the board/paper.
- Draw the major cause categories in the process and connect them to the
backbone of the fishbone chart.
- Method, Equipment, People, Materials [ MEPM ] are favoured as traditional
causes. Some flexibility is necessary depending on the problem being
investigated. Other causes which may be required are; Procedures, Policies,
Environment or Measurement. There are no fixed rules for the number of
causes - make the diagram fit the problem.
|