Purpose How does it work ?
Types and Methods: Top- down Flowcharts 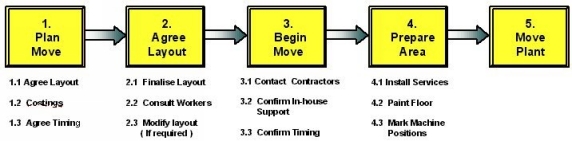 A top down flow chart is an outline picture of the major steps of a process or project. The format will limit the amount of information which can be placed on the chart, which causes the people generating the chart to concentrate on only the steps which are absolutely necessary to the relevant process. The resulting picture will only represent 'useful' work, omitting steps such as rework and inspection which have evolved due to problems occurring in the process. How does this help ? All processes tend to change over time, usually by the addition of steps which cover problems that shouldn't have occured in the first place. Top down flowcharts minimise the detail, to focus only on those steps essential to the process. In other words, only the steps that should happen are charted, rather than what actually happens. Once the major steps, and required sub-steps, are charted, the team can ask "where did we go off course ?" -- "what caused that ?" These activities help to determine which steps are necessary, and which steps merely add complexity. The answers will point the team towards the potential causes of problems, not just the problems themselves. This approach is generally faster, and in most cases, as efficient, as possibly spending weeks developing a detailed flow chart of every step which takes place. Method 1) List the most basic steps in the process. 2) List these steps across the top of a flip-chart. 3) Below each step, list the 'major' sub-steps.
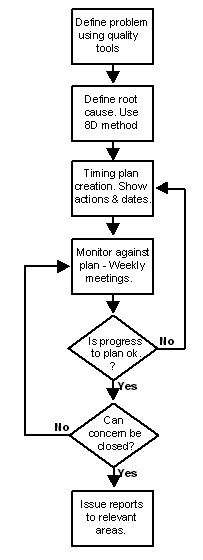
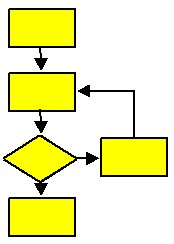
Detailed Flowchart A detailed flowchart includes a lot of information about what happens at every stage of the process. The chart will show all, or most, of the steps of a process, including loops caused by the effects of decisions. This can result in detailed flowcharts being over complex and requiring considerable time to research and gain agreement. For this reason it is important that the level of detail to be shown on the chart is decided at the outset. The flowchart may only show sufficient information to understand the general process flow, or it could have enough detail to show every finite action and decision point. Method 1) Identify the frame or boundaries of the process. Clearly define where the process
being studied starts and finishes. 2) Determine the steps in the process. 3) Arrange the steps in the order they are carried out. 4) Draw the flowchart using the appropriate symbol for each element.
5) Be consistent in the level of detail shown. Varying the level of detail shown at each step can cause problems with understanding the process being charted.
6) Check the flowchart is complete.
Points
|