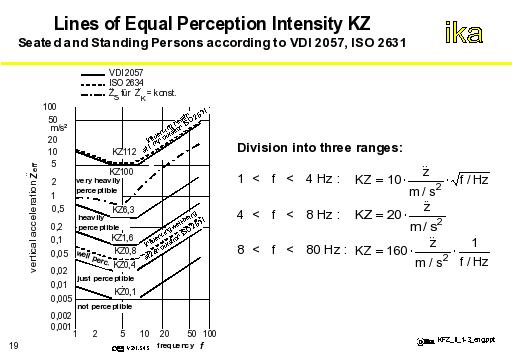
The figure shows the curves of equal perception intensity determined for sitting and standing humans in the VDI specification 2057. For comparison, the reciprocal amplification function is also included.
The curves are divided into three areas, which were linearised for the simplification of the analysis.
Since all investigations done up to now show a correspondence to the fact that the perception of humans begins at approx. 0.8 to 1 Hz and ends at approx. 70 to 100 Hz, the curves are applied in a frequency range between 1 and 80 Hz. The first segment of the curve is from 1 to 4 Hz. Within this segment the KZ values are calculated as indicated in the figure.
In the range between 4 and 8 Hz humans have the highest sensitivity to oscillation:
Within the range between 8 and 80 Hz the KZ value is then calculated.