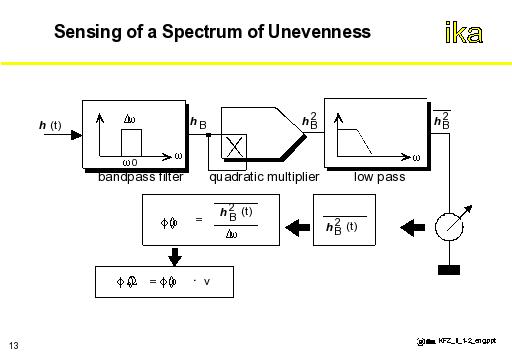
The procedure to define the determination of the unevenness spectrum Φh(Ω) metrologically from a recorded measuring signal h(t) is schematically represented in the figure /38/.
From the measured signal which can be analyzed using a bandpass filter of mean frequency ω0, a frequency range Δω is filtered. The band-pass filter signal generated is then squared and the average value is calculated over a certain period of time. From this average value, defined in the figure as , the value of the power density spectrum for is determined by division with the filter bandwidth Δω.
By shifting the center frequency of the bandpass filter, the power density spectrum for the entire frequency range of interest can be determined.
From the time-frequency-dependent power density spectrum, the spectral density of unevenness can be calculated as a function of the angular path frequency Ω by simple multiplication with the driving speed v. In this case it is assumed that the measurement of the characteristic of unevenness h(t) was determined at constant driving speed v.