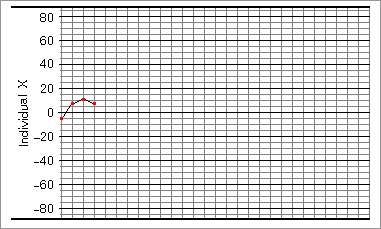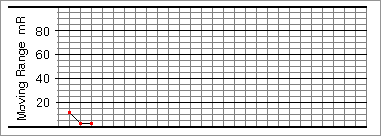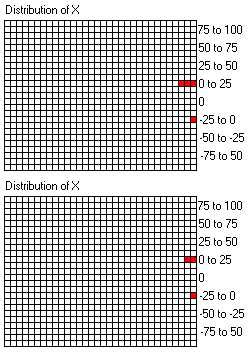
Having calculated these values, it's time to plot the appropriate points.
| Module | A6 | A5 | C2 | A4 | ||||
|---|---|---|---|---|---|---|---|---|
| Date Completed | 20/8 | 21/8 | 23/8 | 27/8 | ||||
| Actual | 33.0 | 37.5 | 48.0 | 22.5 | ||||
| Estimated | 37.5 | 30.0 | 37.5 | 15.0 | ||||
| X | -4.5 | 7.5 | 10.5 | 7.5 | ||||
| mR | 12.0 | 3.0 | 3.0 |
On the X and mR graphs...


...and on the distribution of X graph.
