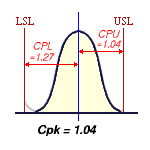
In this exercise, therefore, we can see that the process mean is closer to the UTL than the LTL, and so the Cpk value is 1.04. Once again, although this suggests that the process is capable, it is only just barely so and there is very little margin for error. This Cpk value is well below the figure of 1.33 that many organisations require as a minimum.
As with the Cp value, it may be helpful to view this graphically. The image below shows the distribution of the process. The blue line marks the process mean, and the distance from each specification limit to the mean is shown in red.
