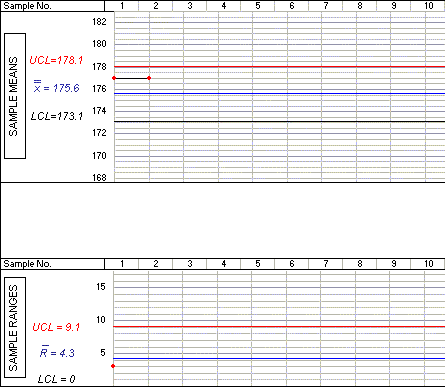
This new information should also be entered on to the two graphs on the chart. As you can see below, we have already plotted the value 177 on the second vertical line of the mean graph. Note also that we have joined the two points together with a straight line. Copy this information onto your sample chart
The calculated value of the range (5) should also be entered on the second vertical line of your range graph. Click on the graph below to indicate the correct position of the point.
