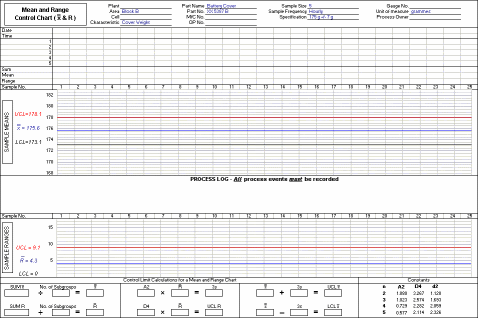
The Mean & Range Chart shown below has been prepared and is ready for plotting. It is ready for use in a process where the variable feature being monitored is the weight (in grams) of battery covers.
In order to follow the exercise more easily, it is recommended that you print out a sample chart to work on. Clicking on the following link will open a new window with a page containing a sample chart which you can print out and which you will need to fill in as you go through the exercise.
