The Mean & Range Chart provides a picture of the overall performance of the process by focusing on the average values of its outputs.
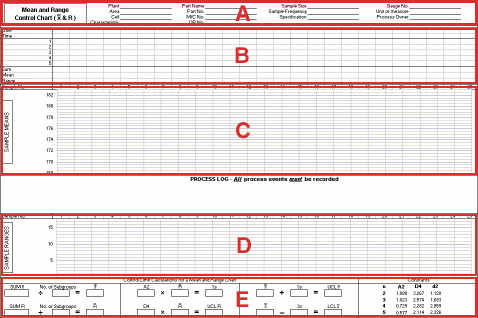
The image below shows an example of a blank Mean and Range Chart. Click on each of the labelled areas in the image for more information about that section of the chart.
