| Demand Curve Approaches |
|
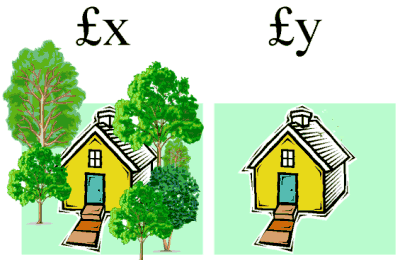
Hedonic Pricing The hedonic price approach derived from property values is a popular measure of the price of environmental differences and has also been extended to other areas. The method is used to evaluate air pollution, the effects of aircraft noise, road traffic, railway noise, a good view, spacious streets, and a "good neighbourhood". Studies can highlight the negative impacts of air pollution, noise pollution etc on land values and thus reveal the implicit or indirect price of environmental difference. The approach works in the following manner. Take the case of a house that is close to a scenic landscape or beach. The proximity of this house to a scenic view or beach increases its value relative to a similar house in another less favourable location. This in turn allows for a indirect determination of the value of the environmental amenity itself by comparing the different prices attached to the two houses. |
 |
|
The process is carried out in two stages. In stage 1 the price paid for the environmental service such as the scenic view, is estimated by investigating the statistical relationship between the service and a related issue for which the price is known e.g. house prices. So, the implicit price is estimated by first step regression analysis where house prices would be regressed on different characteristics. In stage 2 the "price" is used to derive a demand curve or marginal willingness to pay (WTP) function from these characteristics. This is carried out by regressing the implicit price against observed samples and other variables to estimate the demand function. For example; investigate the relationship between house price and the presence of trees, in order to gain an awareness of the value of trees in the urban environment. In stage 1 the "price" of trees would be estimated carrying out statistical analysis and deriving a function similar to the one below; |
 |
|
Where b1 is the coefficient of interest since this relates to the focus, i.e. presence of trees Analysis of the equation provides the proportion of the house price that can be attributed to the presence of trees known as Pt i.e. price of trees. A demand curve equation is then derived relating the number of trees around houses (T) to the price paid for them (Pt) and any other relevant variables (Z) So; |
 |
|
The curve is plotted and the area under the curve indicates the "hidden" value. There are obviously difficulties to overcome with this methodology. With house prices for example some or all of the issues such listed below may need to be incorporated into the variables;
The equations in figure 8 illustrate that the method can become quite complex. These equations form part of the first stage of a hedonic pricing method to identify the intrinsic value that shoppers attribute to clothes containing cotton that has been organically grown rather than cotton grown using traditional methods with pesticides. The variables considered are;
|
 |