| Key: |
| UCL = Upper Control Limit |
| LCL = Lower Control Limit |
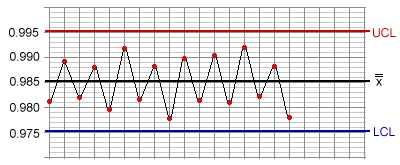
In addition to plots outside the control limits and long trends or runs, other distinct patterns may appear in the plotted data that provide evidence of possible special causes. Common cause variation is essentially random in nature, so any pattern which seems to be regular and repeating is worth investigating. An example, illustrated below, would be plots that alternate up down.
| Key: |
| UCL = Upper Control Limit |
| LCL = Lower Control Limit |