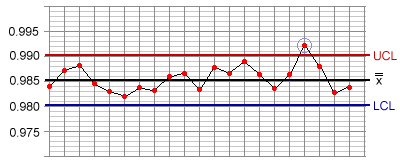
| Key: |
| UCL = Upper Control Limit |
| LCL = Lower Control Limit |
The presence of one or more points above the Upper Control Limit (UCL) or below the Lower Control Limit (LCL) is primary evidence that the process is no longer in statistical control.
| Key: |
| UCL = Upper Control Limit |
| LCL = Lower Control Limit |
Such plots are very rarely due to common causes of variation, therefore this evidence suggests the existence of a special cause affecting the process.
A plot outside the control limits is a signal for immediate investigation to verify and identify the special cause.
A plot above the UCL could indicate that:
A plot below the LCL could indicate that: