The data recording area of your chart should now look like this:
| No. | Characteristic | 1 | 2 | 3 | 4 | 5 | 6 | 7 | 8 | 9 | 10 | 11 | 12 | 13 | 14 | 15 | 16 | 17 | 18 | 19 | 20 | f | % |
|---|---|---|---|---|---|---|---|---|---|---|---|---|---|---|---|---|---|---|---|---|---|---|---|
| 1 | Blisters | 1 | 1 | 1 | 1 | 4 | 5 | ||||||||||||||||
| 2 | Scratches | 1 | 1 | 1 | 3 | 4 | |||||||||||||||||
| 3 | Overspray | 1 | 1 | 1 | 3 | 4 | |||||||||||||||||
| 4 | Orange Peel | 1 | 3 | 2 | 2 | 3 | 2 | 3 | 2 | 3 | 2 | 1 | 3 | 2 | 1 | 30 | 36 | ||||||
| 5 | Flotation | 2 | 1 | 3 | 4 | ||||||||||||||||||
| 6 | Off Colour | 1 | 1 | 1 | |||||||||||||||||||
| 7 | Sags/Runs | 1 | 4 | 3 | 1 | 3 | 1 | 2 | 3 | 2 | 3 | 2 | 4 | 1 | 3 | 2 | 35 | 42 | |||||
| 8 | Gun Spits | 2 | 2 | 2 | |||||||||||||||||||
| 9 | Dirt | 1 | 1 | 1 | |||||||||||||||||||
| 10 | Dull Finish | 1 | 1 | 1 | |||||||||||||||||||
| Defects (c) | 6 | 8 | 4 | 5 | 2 | 4 | 3 | 2 | 5 | 3 | 4 | 2 | 4 | 5 | 3 | 4 | 6 | 5 | 5 | 3 | 83 | <<sum c | |
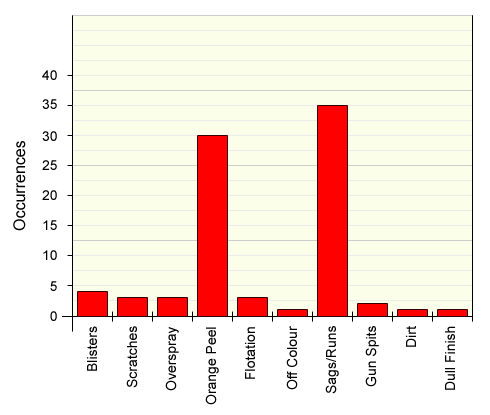
Presented on a bar chart, the data would look like this:
