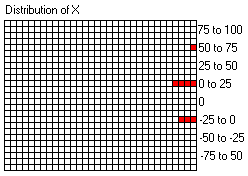
Your recording boxes should now look like this:
| Module | A6 | A5 | C2 | A4 | C20 | G3 | MT | M1 |
|---|---|---|---|---|---|---|---|---|
| Date Completed | 20/8 | 21/8 | 23/8 | 27/8 | 27/8 | 27/8 | 28/8 | 28/8 |
| Actual | 33.0 | 37.5 | 48.0 | 22.5 | 55.5 | 90.0 | 67.5 | 3.75 |
| Estimated | 37.5 | 30.0 | 37.5 | 15.0 | 45.0 | 22.5 | 75.0 | 15.0 |
| X | -4.5 | 7.5 | 10.5 | 7.5 | 10.5 | 67.5 | -7.5 | -11.25 |
| mR | 12.0 | 3.0 | 3.0 | 3.0 | 57.0 | 75.0 | 3.75 |
And your distribution graph like this:

Please check and, if necessary, correct your chart before continuing.