Now that we have calculated both values, we can make the necessary plots on the charts.
| Module | A6 | A5 | C2 | |||||
|---|---|---|---|---|---|---|---|---|
| Date Completed | 20/8 | 21/8 | 23/8 | |||||
| Actual | 33.0 | 37.5 | 48.0 | |||||
| Estimated | 37.5 | 30.0 | 37.5 | |||||
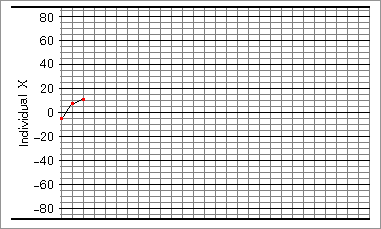
| X | -4.5 | 7.5 | 10.5 | |||||
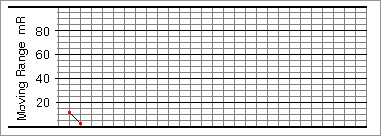
| mR | 12.0 | 3.0 |
Firstly, plot the X value on the X graph:
And then the mR value on the mR graph. Don't forget to join the points with a straight line:
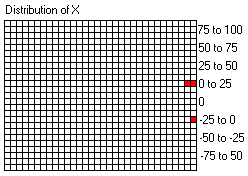
Finally, we must remember to enter a mark on the distribution of X graph: