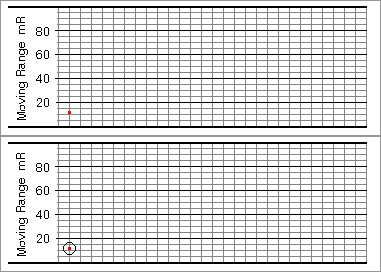
You can now add this information to the second column of the recording boxes.
| Module | A6 | A5 | ||||||
|---|---|---|---|---|---|---|---|---|
| Date Completed | 20/8 | 21/8 | ||||||
| Actual | 33.0 | 37.5 | ||||||
| Estimated | 37.5 | 30.0 | ||||||
| X | -4.5 | 7.5 | ||||||
| mR | 12.0 |
You also need to plot this point on the moving range graph. Don't forget that the point should be placed on the second vertical line on the graph, which will be above the second column of data recording boxes.
